
Bitcoin faced renewed selling pressure late Sunday as prices slipped below the $85,000 mark, reigniting volatility (a return or an increase in the rate and magnitude of price fluctuations) across the crypto market. At the same time, Strategy chair Michael Saylor hinted at another Bitcoin purchase, signaling continued institutional confidence despite broader macroeconomic concerns.

Bitcoin dropped to an intraday low of $87,600 on Coinbase. This move marked the asset’s lowest level in nearly two weeks and continued a pattern of sharp Sunday price declines that traders have observed throughout recent market sessions. Although Bitcoin later recovered above $89,000, the sudden dip underscored persistent uncertainty among investors.
Notably, Bitcoin last traded at similar levels on December 2, when it rebounded from a deeper correction near $84,000. Since then, prices have oscillated within a wide range, reflecting heightened sensitivity to global economic signals and central bank decisions.
Saylor Hints at Another Bitcoin Buy
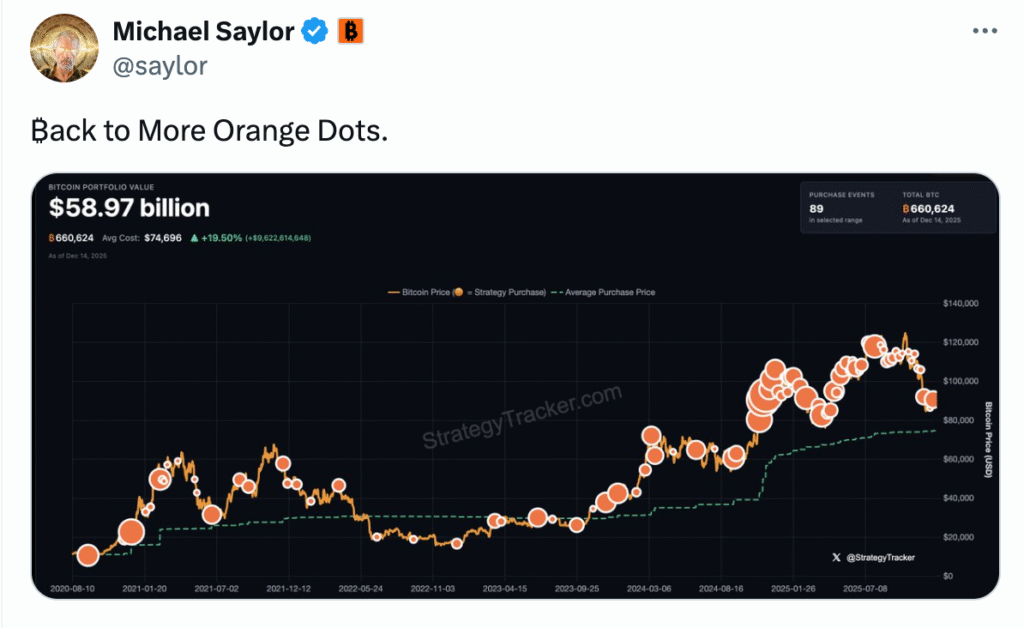
As Bitcoin prices weakened, Michael Saylor once again captured market attention. On Sunday, he posted “Back to More Orange Dots” on X, accompanied by a portfolio chart that many investors interpret as a signal of an upcoming Bitcoin purchase. Historically, Saylor has used similar posts ahead of Strategy’s major Bitcoin acquisitions.
Earlier this month, Strategy completed its largest Bitcoin purchase since late July. On December 12, the company acquired 10,624 BTC, according to SaylorTracker data. That move reinforced Strategy’s long-term accumulation strategy, even as market conditions remained volatile.
Currently, Strategy holds approximately 660,624 BTC, valued at nearly $58.5 billion based on prevailing prices. The firm maintains an average purchase price of $74,696 per coin, which places it comfortably in profit despite recent market pullbacks. As a result, Saylor’s latest hint has fueled speculation that the company could use the current dip as another buying opportunity.
Sunday Selling Pressure Raises Market Concerns
“Markets move in anticipation, not on the announcement itself,” the analyst explained. This perspective suggests that Bitcoin’s recent decline reflects positioning rather than panic.
Justin d’Anethan, head of research at Arctic Digital, offered a more cautious assessment. He noted that while Bitcoin has recovered from November’s lows, the drop toward $88,000 still “feels like a defeat” for short-term bulls.

“In Japan, rate expectations revived fears of another carry trade unwind,” d’Anethan said. “As a result, macro funds and active traders took profits and reduced exposure while expecting further downside.”
Bitcoin Likely to Remain Range-Bound
Looking ahead, analysts expect Bitcoin to remain range-bound unless a major catalyst emerges. D’Anethan predicted that prices would likely fluctuate between $80,000 and $100,000 in the near term as traders wait for clearer signals from global markets.
Despite short-term volatility, long-term confidence remains intact among institutional buyers like Strategy. Saylor’s continued accumulation strategy underscores a broader conviction that Bitcoin’s long-term value proposition outweighs temporary, macro-driven price fluctuations.
As Bitcoin navigates a challenging macro environment, market participants will closely watch both central bank decisions and on-chain accumulation trends. For now, Saylor’s “orange dots” serve as a reminder that some of the market’s biggest players continue to buy the dip.
What does the Current Bitcoin Trend Indicate?

| Trend Factor | Price Level (USD) | Market Insight |
| Recent Low | $85,000 | Bitcoin formed a short-term bottom near this level, indicating temporary buyer interest. |
| Major Support Zone | $65,000 – $70,000 | This zone represents strong historical demand and aligns with the projected correction area on the chart. |
| Immediate Resistance Zone | $92,000 – $95,000 | Bitcoin faces selling pressure in this range, making it a key breakout level for bullish continuation. |
| Correction Range | $65,000 – $70,000 | A deeper pullback into this range would confirm a larger corrective phase before trend reversal. |
If Bitcoin holds above the $85,000 level and breaks decisively above the $92,000–$95,000 resistance zone, the trend could shift toward a renewed bullish phase. However, failure to sustain current levels may increase the probability of a deeper correction toward the $65,000–$70,000 support zone.
Until a confirmed breakout or breakdown occurs, Bitcoin is likely to remain range-bound, with volatility driven by macroeconomic factors and broader market sentiment.

